How to Read Forex Charts: Candlestick Patterns, Timeframes and Trend Analysis
Understanding the world of currency trading is essential for anyone eager to enter the global financial market. Learning the art of interpreting price movements on various charts can unveil potential trading opportunities. This skill is vital for traders aiming to make informed decisions.
IG platforms provide a range of timeframes, from tick-by-tick data to an entire month of historical price movements. By mastering these tools, traders can visualize currency pair trends more effectively. This guide offers a comprehensive overview of interpreting the complex data presented on standard forex charts.
By grasping the visual language of the market, individuals can better comprehend the price movements that drive currency fluctuations worldwide. Our analysis covers essential techniques and tools, enabling traders to navigate the modern trading environment with confidence and precision.
Understanding Forex Charts and Their Role in Trading
Navigating the intricacies of currency trading requires a solid grasp of visual data. A forex chart is a graphical representation that illustrates how the price of a currency pair changes over time. On the vertical y-axis, traders can observe price fluctuations, while the horizontal x-axis represents the time scale.
This visual format serves as a vital tool for traders, enabling them to monitor the changing price of selected currency pairs over specific periods. By plotting price on one axis and time on the other, it becomes easier to visualize market history.
The importance of visual data in trading cannot be overstated. It allows for the rapid identification of trends and patterns, crucial for making informed decisions. Before modern charts, traders relied on reading the ‘tape’ to analyze raw price movements.
Today, these charts provide essential information for conducting thorough technical analysis on any currency pair. They empower traders to make strategic choices based on historical data.
Exploring Different Chart Types in Forex

Different chart types provide unique insights into currency trading. Among the most popular are the candlestick chart and HLOC (high, low, open, close) chart. The candlestick chart, originating in 18th-century Japan, is favored for its ability to illustrate price movements effectively. It captures the opening, closing, high, and low prices within a specific time period, making it a comprehensive tool for traders.
In contrast, the HLOC chart presents the same data but in a more straightforward format. This chart type allows traders to view essential price information without the visual complexity of candlesticks.
Additionally, line charts are the simplest type of chart, displaying only the closing price over a designated time period. A mountain chart, a variation of the line chart, shades the area beneath the line, creating a silhouette effect. Bar charts, or OHLC charts, enhance this view by showing the opening, high, low, and closing prices for any currency pair.
Choosing the right type of chart depends on personal preference and the specific information needed for effective technical analysis.
Mastering How to Read Forex Charts

Grasping the fundamentals of price movement is crucial for effective trading in the currency market. Each candlestick displays four specific prices: the opening, closing, high, and low for the selected time period. Understanding these price points helps traders interpret market psychology.
A green candlestick indicates the price closed higher than it opened, while a red candlestick shows a lower closing price. Long green candlesticks often signify strong buying pressure, whereas long red ones suggest that sellers are driving the price movement.
The body of a candlestick represents the range between the opening and closing prices, while the wicks illustrate the high and low. By analyzing these four price points, traders can determine who controls the market during any given time period.
Mastering these fundamentals allows traders to uncover the story behind every bar or candlestick on their trading platform’s interface.
Decoding Timeframes and Their Impact on Trading Decisions

The choice of timeframe in trading can significantly influence decision-making. Traders can select timeframes ranging from one minute to one month on professional platforms like MetaTrader 4. Understanding the dynamics of different time periods is essential for effective analysis.
For instance, a 15-minute timeframe will reveal different price dynamics compared to a weekly chart. Many experienced traders utilize multiple time frame analysis to identify long-term trends while pinpointing precise entry points on shorter timeframes.
A day trader might focus on 5-minute or 15-minute charts, whereas a position trader will likely prefer daily or weekly timeframes. By changing the timeframe, traders can view how the price of a currency pair has developed over various intervals.
Your choice of timeframe should align with your overall trading strategy and the specific goals you have for your financial portfolio. This alignment helps in managing risk and maximizing potential returns.
Utilizing Technical Analysis for Trend Insights

Technical analysis is a vital component for traders seeking insights into market trends. By studying historical price movements, traders can identify potential future directions. This approach is essential for making informed decisions in the dynamic world of currency trading.
One significant pattern to recognize is the doji. A doji occurs when the opening and closing prices are equal, indicating market indecision. This signal can suggest a potential trend reversal, making it crucial for traders to monitor.
Additionally, understanding support and resistance levels is key. Support levels are areas where prices tend to pause as buying demand increases. Conversely, resistance levels act as barriers where prices may struggle to rise further. Observing these levels can provide valuable insights into price movements.
- Technical analysis involves studying historical chart patterns to predict future price movement.
- A doji signal is a neutral pattern that may indicate an imminent reversal when found within an established trend.
- Support and resistance levels act as psychological barriers for currency pairs.
- Long wicks on candlesticks can reveal strong support and resistance levels.
- Connecting market psychology with price patterns aids traders in making informed judgments.
Setting Up Your Chart on Trading Platforms
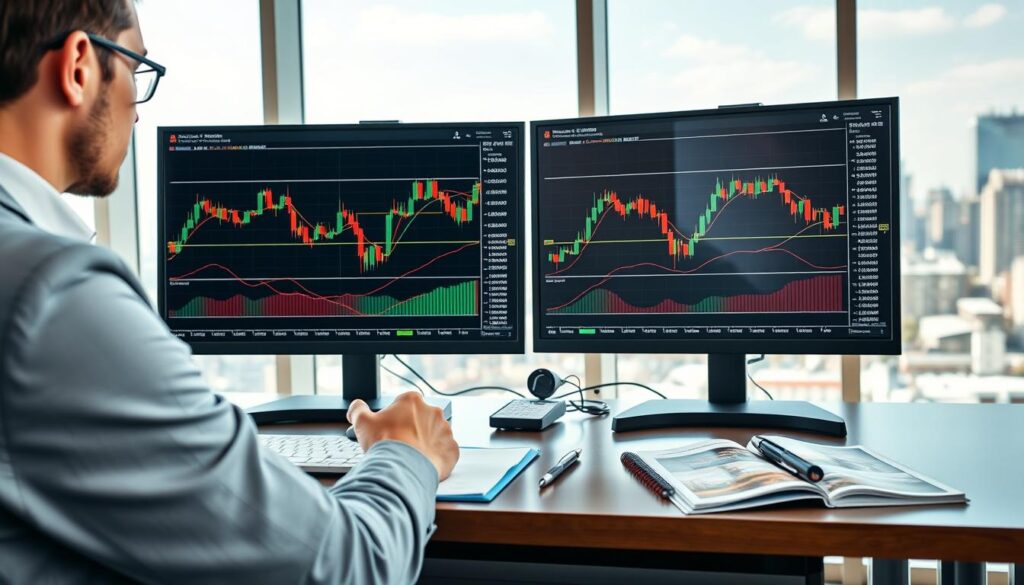
The initial step in successful trading involves effectively configuring your chart settings on platforms like MetaTrader 4. This setup is crucial for conducting effective technical analysis.
Trading platforms plot data by connecting price points across the horizontal axis, which represents the time scale of the market. You can customize your chart settings to reflect different timeframes, from tick-by-tick data to a full month of historical information.
Accessing live charts allows traders to see buying and selling activity in real-time for any financial instrument they wish to trade. This feature is vital for making informed decisions based on current market trends.
Ensure your platform is configured to display the specific chart types that best suit your personal trading style and goals. A well-organized chart setup can significantly improve your ability to analyze price movements and identify potential trading opportunities.
Avoiding Common Pitfalls in Forex Chart Analysis

A clear understanding of common errors can empower traders to navigate the forex landscape more effectively. Many beginners fall into the trap of information overload. This occurs when too many indicators clutter a single chart, making it hard to focus on essential data.
Consistent analysis is vital. A disciplined approach to risk management ensures that no single trade threatens your entire financial account. Avoid over-analyzing minor price movements, as this can lead to emotional decision-making and unnecessary trading risk.
Traders should remember that past performance and forecasts are not reliable indicators of future results in the volatile forex market. Developing a systematic way to analyze charts will help filter out noise and focus on the most relevant market data.
Evolving Your Skills: Final Thoughts on Chart Reading Mastery
Building expertise in interpreting price data is vital for any aspiring trader. Mastering the art of reading charts is a journey that unfolds with experience. By consistently applying technical analysis and managing risk, traders can enhance their ability to spot profitable opportunities.
Every chart type has its advantages and disadvantages. The best choice aligns with individual trading strategies. Continual study of historical data and refining candlestick pattern interpretations keeps traders ahead of market changes.
With dedication and practice, anyone can develop the skills needed to navigate the complexities of global currency trading confidently.