Spread Finance Definition: Types and Real Market Examples
In the world of investing, the term spread is a fundamental concept. It generally describes the difference between two related values. This simple idea appears in many forms across different markets.
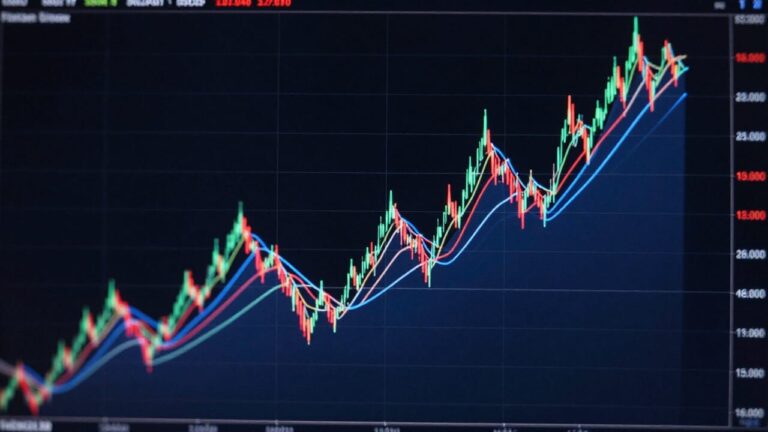
Traders encounter this concept daily. In stock markets, it often refers to the gap between the buying and selling price. For bonds, it indicates the yield difference between two securities.
Understanding these differences is crucial for effective participation in financial markets. They impact trading costs and help assess market liquidity. They also reveal information about risk and potential profit opportunities.
This article explores the main types of spreads used in various trading contexts. It covers everything from basic bid-ask spreads to sophisticated option strategies. Grasping these concepts provides a clearer view of overall market dynamics.
This article is part of our complete Spread Trading Guide, where we explain spreads, pricing models and real market examples in detail.
Introduction to Spread Finance
The difference between two prices, known as the spread, acts as a vital sign for market health. It is a core component for anyone involved in buying and selling assets.
The Importance of Understanding Spreads
This metric functions as the lifeblood of financial markets. It reveals three critical pieces of information simultaneously.
A narrow spread often indicates a healthy, liquid market where large orders can be filled easily. A wide spread suggests lower liquidity and higher risk, where small trades can move prices significantly.
For investors, this knowledge directly impacts profitability. Being aware of the spread is essential for minimizing transaction costs. This awareness helps maximize net returns on any investment.
- Current liquidity conditions
- The overall risk appetite of participants
- The general efficiency of the market
Context in Today’s Financial Markets
Modern electronic platforms and high-frequency trading have transformed spread dynamics. In many liquid markets, spreads have tightened considerably.
Spreads behave differently under various conditions. They typically narrow during stable, high-liquidity periods. Conversely, they widen during times of volatility or uncertainty.
This knowledge provides insights into market quality. It helps investors identify the best times and venues for executing trades. Widening spreads can also serve as an early warning sign of increasing risk or deteriorating conditions.
Understanding the “spread finance definition”
Central to market operations is the spread, which quantifies the separation between related economic figures. This measurement appears across various trading contexts with consistent principles.
The most familiar application involves the bid-ask relationship. The bid represents the highest amount buyers offer, while the ask shows the lowest amount sellers accept. The gap between these figures forms the basic spread.
This concept extends beyond simple price differences. It applies to yield variations between bonds and interest rate gaps in lending. Each context maintains the core principle of measuring disparity.
All spread calculations share a common foundation. They measure some form of differential between two connected values. Whether prices, yields, or rates, the underlying logic remains consistent.
Understanding this fundamental definition prepares traders for specialised applications. Different markets employ unique spread types while adhering to the same basic measurement concept.
Exploring the Bid-Ask Spread

At the heart of every securities transaction lies the bid-ask spread, a fundamental market mechanism. This concept represents the immediate cost of trading any asset. It shows the gap between what buyers are willing to pay and what sellers demand.
The bid-ask spread functions as the market’s pulse. It reveals real-time supply and demand dynamics for any traded security.
Defining Bid Price and Ask Price
The bid price represents the highest amount buyers currently offer for an asset. It reflects the maximum price someone will pay right now. This figure establishes the demand side of the market equation.
Conversely, the ask price shows the lowest amount sellers will accept. It indicates the minimum price required for immediate sale. This creates the price a buyer must pay for quick execution.
The difference between these two prices forms the bid-ask spread. This gap represents the transaction cost for immediate trade execution.
Indications of Market Liquidity
The size of the bid-ask spread directly signals market liquidity conditions. A narrow gap indicates high liquidity with many participants. Large orders can execute with minimal price impact.
A wide spread suggests lower liquidity and higher trading costs. Fewer market participants mean larger price gaps. This increases the break-even point for profitable trades.
Market makers profit from this difference by quoting both prices. They provide liquidity while earning from the spread. This system ensures continuous market operation.
Types of Financial Spreads
Traders and investors work with several classifications of market gaps that provide unique insights into asset valuation. These measurements help assess different aspects of trading conditions across various markets.
Stock Market Spreads
In equity markets, the most common measurement is the bid-ask difference. This represents the immediate cost of executing a trade. Market makers profit from this gap while providing liquidity.
Another important category involves price differences between various classes of the same company’s stock. For example, Class A and Class B shares often trade at different values. These gaps reveal investor preferences regarding voting rights and dividend expectations.
Bond Market Yield and Credit Spreads
Fixed-income markets rely heavily on yield differentials to assess risk. These measurements compare the returns between bonds with different characteristics. They serve as crucial indicators of market sentiment.
Credit measurements specifically compare corporate debt to government securities of similar maturity. If a 10-year Treasury bond yields 3% and a corporate bond yields 5%, the 2% gap compensates for default risk. Wider gaps indicate higher perceived risk, while narrower ones suggest confidence.
These tools help fixed-income participants evaluate economic conditions effectively. Understanding each type provides valuable context for investment decisions.
Spread Trading Across Markets

Across global trading floors, sophisticated investors use spread strategies to profit from relative price movements rather than absolute price changes. This approach involves simultaneous positions in related securities bundled as a single unit.
Each component of these trades is called a “leg.” Traders execute them as single units for three key benefits.
- Synchronized completion of both positions
- Elimination of single-leg execution risk
- Profit potential from spread movements specifically
Stock Trading and Spread Indicators
In equity markets, spread indicators help assess relative value between related stocks. They identify arbitrage opportunities where price discrepancies exist between similar companies or share classes.
Paired positions can hedge against broad market movements. This risk management technique allows traders to focus on the relationship between specific securities rather than overall market direction.
Spread Implications in Forex and Futures
Futures markets commonly feature calendar spreads based on delivery dates. For example, traders might position January wheat against October wheat contracts. These time spreads capitalize on expected performance differences.
Intercommodity spreads exploit relationships between different assets. The historic ratio between silver and gold prices represents a classic example. Currency pair gaps fluctuate based on volatility and liquidity across global sessions.
Real Market Examples of Spread Trading
Seeing real market examples brings spread concepts to life for traders. These practical illustrations show how the gap between prices and yields functions daily.
In the stock market, a highly liquid asset like Apple Inc. (AAPL) often shows a tight gap. A bid of $150.00 and an ask of $150.02 creates a minimal difference of just $0.02. This reflects high liquidity and low transaction costs.
Conversely, a thinly traded small-cap stock presents a different picture. A bid of $10.00 and an ask of $10.50 results in a much larger $0.50 gap. This illustrates how lower volume increases the cost to enter and exit a position.
The bond market uses credit measurements to assess risk. If a 10-year U.S. Treasury yields 3% and a similar corporate bond yields 5%, the 2% difference compensates for default risk. This is a clear example of a credit spread.
During the 2008 financial crisis, these yield gaps widened dramatically. Investors demanded higher returns for the increased risk. This historical event shows how market stress impacts these measurements.
Another practical case involves a stock with a bid of £10.50 and an ask of £12.00. The £1.50 difference is the immediate cost a trader must overcome. Understanding these ranges helps assess whether conditions are favorable.
Influential Factors on Spread Dynamics
The width of price differentials in securities trading responds dynamically to multiple market influences that affect execution quality. These elements determine trading costs and signal underlying market health.
Liquidity and Volatility Effects
Market liquidity represents one of the most significant factors affecting price gaps. Highly liquid markets support tight differentials while illiquid conditions necessitate wider separations.
When trading volume decreases due to economic events, executing orders becomes challenging. This difficulty causes market makers to widen gaps as protection against inventory risk.
Volatility serves as another critical element. Rapid price movements increase the risk that values will change against quoted positions. This uncertainty forces participants to increase their compensation margins.
Risk and Market Conditions
Heightened risk perceptions cause traders to become more cautious. They widen price separations as compensation for increased uncertainty and potential adverse movements.
Major economic announcements and geopolitical developments typically trigger gap widening. Market participants reassess asset values during these periods. Liquidity providers may temporarily reduce their presence or increase risk premiums.
Understanding these factors helps investors anticipate when trading costs might rise. This knowledge allows them to adjust strategies during volatile conditions or avoid transactions when spreads are unfavorable.
Spread Considerations in Lending and Credit Markets

Credit markets operate on a fundamental principle where lending institutions earn their primary income from the gap between borrowing and lending rates. This difference represents the compensation for risk, operational costs, and profit margin beyond basic funding expenses.
When a borrower pays an interest rate above a benchmark, this premium constitutes the lending spread. For example, if the prime rate is 3% and a mortgage charges 5%, the 2% difference covers the lender’s costs and risk.
Bank Lending Margins
Financial institutions measure profitability through net interest margin. This represents the difference between what they charge on loans and what they pay for deposits.
Wider margins generate higher profits for banks during stable economic conditions. Narrower margins occur when competition increases or funding costs rise.
Mortgage and Corporate Loan Spreads
Mortgage rates typically compare to long-term government bond yields. The difference reflects housing market health and credit availability.
Corporate loan spreads measure the premium businesses pay above benchmark rates. These gaps widen significantly during economic uncertainty as perceived credit risk increases.
Understanding these measurements helps investors assess institutional profitability. Borrowers can also evaluate whether loan terms reflect fair market conditions.
Spread Strategies in Options Trading
In the realm of options, spread techniques represent deliberate strategies combining multiple contracts to capitalize on market expectations. These multi-leg approaches differ from simple price gaps discussed earlier.
They allow traders to fine-tune risk exposure while targeting specific profit scenarios. Each strategy involves simultaneous buying and selling of different options.
Call and Put Spread Techniques
A bull call spread involves purchasing a call option at a lower strike price while selling another at a higher strike. This creates a net debit position with defined risk.
For example, buying a $50 call for $3 and selling a $55 call for $1 costs $2 net. Maximum profit of $3 occurs if the underlying asset reaches $55 at expiration.
Bear put spreads work similarly for downward price movements. They purchase higher strike puts while selling lower strike puts. This limits both potential profit and loss compared to single option positions.
Advanced Options Strategies
Butterfly spreads combine options at three strike prices to profit from low volatility. They involve buying one in-the-money option, selling two at-the-money options, and buying one out-of-the-money option.
Calendar spreads exploit different time decay rates. Traders buy longer-dated options while selling shorter-dated ones at identical strike prices.
Box spreads create arbitrage opportunities by combining bull call and bear put strategies. They lock in risk-free profit when options are mispriced relative to theoretical values.
Tools and Platforms for Spread Analysis
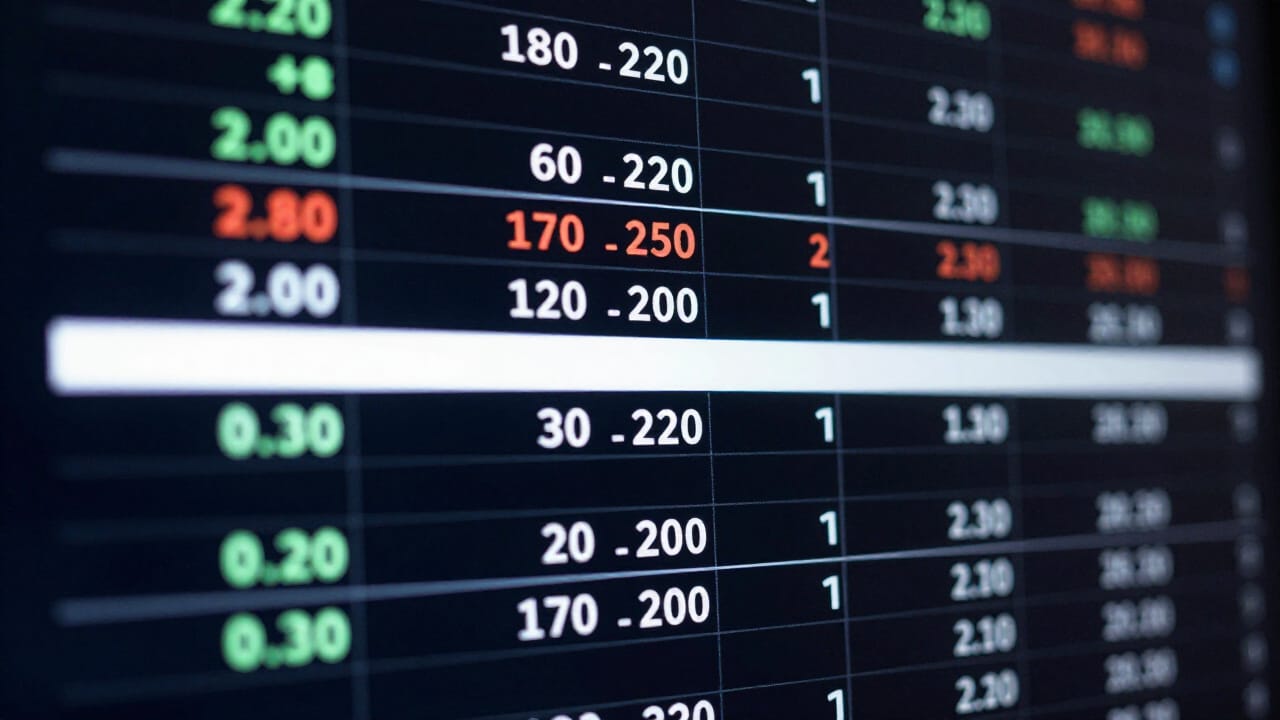
Access to real-time spread data has become essential for traders seeking to optimize their execution strategies. Modern platforms offer sophisticated analytical capabilities that transform how participants assess market conditions.
Advanced systems like Bookmap provide unique visualization features. They display not only the current inside spread but also historical patterns of bid-ask movement. This temporal context helps traders understand dynamic market behavior.
Day traders benefit significantly from these analytical tools. They execute multiple transactions where small differences accumulate into substantial costs. Platforms with detailed visibility become crucial for active strategies.
Many brokerage services now include comprehensive features:
- Real-time spread indicators and alerts
- Comparative analysis across different securities
- Historical pattern recognition capabilities
- Cross-market spread analytics
Specialized data services cover various asset classes. They provide insights into equity, options, futures, and credit markets. This enables comprehensive analysis across different trading environments.
Traders should conduct thorough research before making decisions. They must consider their expertise, risk tolerance, and portfolio allocation. Choosing the right analytical platform supports informed market participation.
Managing Spread Costs Effectively
Active traders can significantly improve their net returns by implementing smart strategies to manage transaction expenses. These approaches help minimize the impact of trading costs that accumulate with frequent market activity.
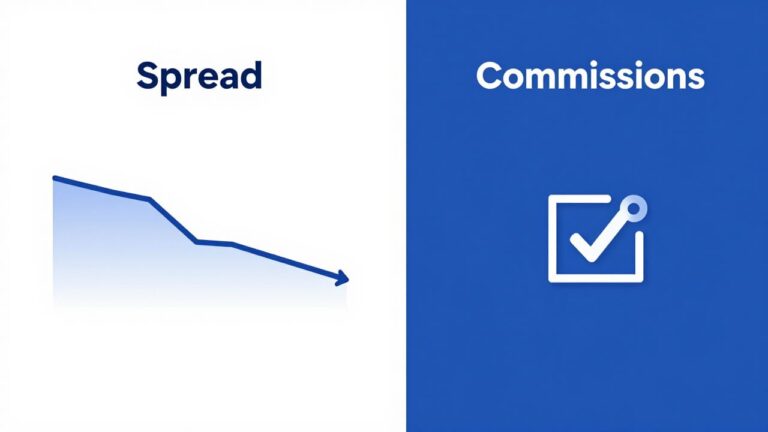
The gap between bid and ask prices represents the immediate expense for executing market orders. This difference compensates brokers and exchanges for providing instant trade facilitation.
Balancing Trades and Use of Limit Orders
Traders can potentially reduce overall expenses by balancing their buy and sell activities. Avoiding consistent one-directional trading prevents always crossing the price difference in the same manner.
Using limit orders instead of market orders provides significant cost control. This approach allows traders to set specific price levels they’re willing to accept. When orders execute at these predetermined levels, they may avoid paying the full transaction expense.
Placing limit orders near current market prices transforms traders into liquidity providers. They potentially capture the price difference rather than paying it. This strategy works particularly well in markets with good liquidity.
Comparing offerings across multiple brokers helps identify the most favorable conditions. Different platforms may present varying price gaps for the same securities. Selecting low-cost trading platforms with competitive structures further minimizes total expenses.
Employing lower leverage reduces cost impact proportionally. Higher leverage amplifies both position size and associated transaction expenses. Conservative leverage strategies prove more cost-efficient for active participants.
Closing Perspectives on Spread Finance
The gap between buying and selling prices serves as more than just a transaction cost—it’s a window into market psychology. This seemingly small element accumulates significantly across multiple trades.
Understanding these price differentials empowers investors to make better decisions. They can assess liquidity conditions and identify optimal entry points. This knowledge benefits both active traders and long-term participants.
The relationship between liquidity and transaction costs represents essential value for anyone in the market. Analyzing these dynamics helps maximize returns on any investment.
Ultimately, spread awareness provides insights beyond cost management. It reveals risk perceptions and structural characteristics that inform broader strategies. This understanding creates a foundation for successful market participation.